FAERS Reporting Rate Calculator
Understand Your Side Effect Risk
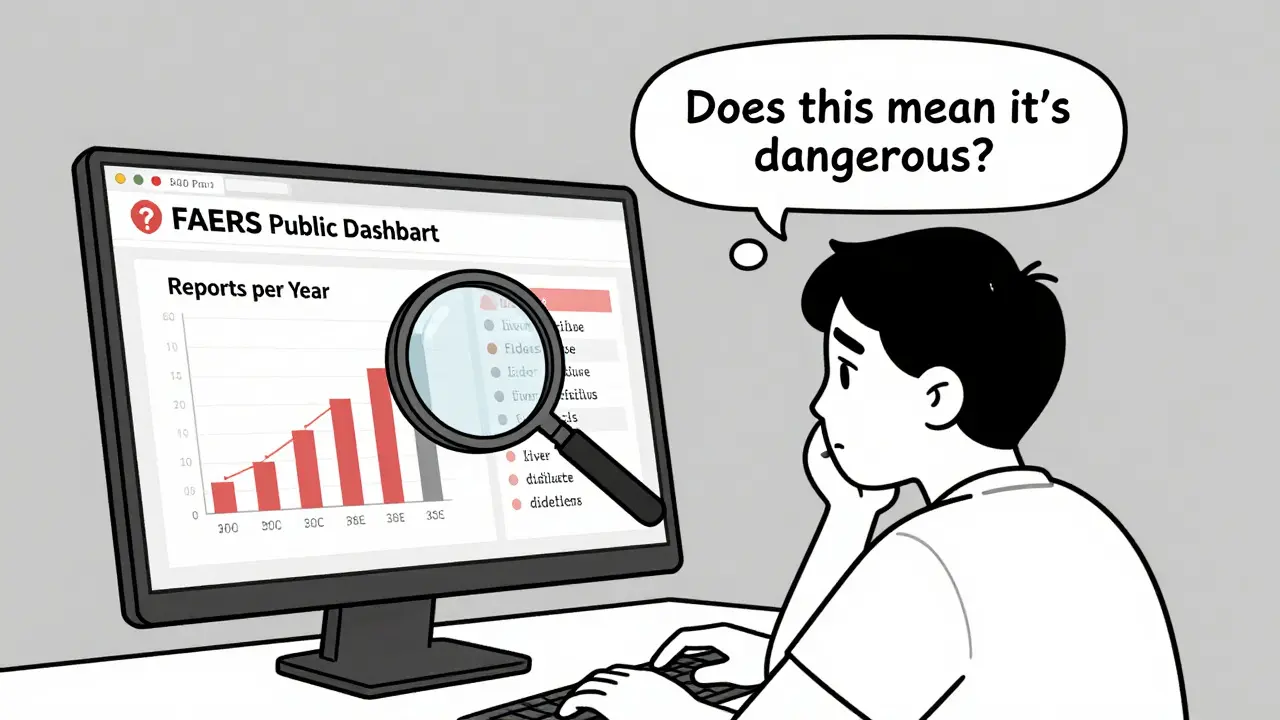
FAERS reports alone don't show risk. This tool estimates reporting rates based on usage data. Remember: More reports don't always mean more danger.
Results will appear here after calculation
When you're trying to find out if a medication might cause serious side effects, the FAERS database is one of the most important tools available. But it’s not a simple search engine. If you type in a drug name and take the first numbers you see at face value, you could easily misunderstand the risk. The FDA’s Adverse Event Reporting System holds over 2.7 million reports from 2014 to 2024, but those numbers don’t tell you how common a side effect really is. They just tell you what people reported. And not everyone reports.
What FAERS Actually Shows - And What It Doesn’t
FAERS collects reports of adverse events - things like liver damage, heart palpitations, or sudden dizziness - after a drug is on the market. These reports come from doctors, pharmacists, patients, and drug manufacturers. Manufacturers have to send in serious cases within 15 days by law. But here’s the catch: the system doesn’t confirm if the drug actually caused the problem. A patient takes a new blood pressure pill and has a stroke two weeks later. They report it. The FDA logs it. But maybe they had undiagnosed high cholesterol. Maybe they skipped their other meds. FAERS doesn’t sort that out.
That’s why experts say FAERS is for signal detection, not risk calculation. If 50 people report liver failure after taking Drug X, and only 2 reported it with Drug Y, that’s a red flag. It doesn’t mean Drug X causes liver failure in 50 out of every 100 users. It means the FDA should look deeper - maybe run a study, check lab data, or update the warning label.
How to Search the FAERS Public Dashboard Correctly
The easiest way to start is with the FAERS Public Dashboard. It’s free, web-based, and updated in real time as of August 2024. That’s a big change from the old quarterly system, where safety signals could take months to appear.
- Go to the dashboard and click the blue search bar at the top.
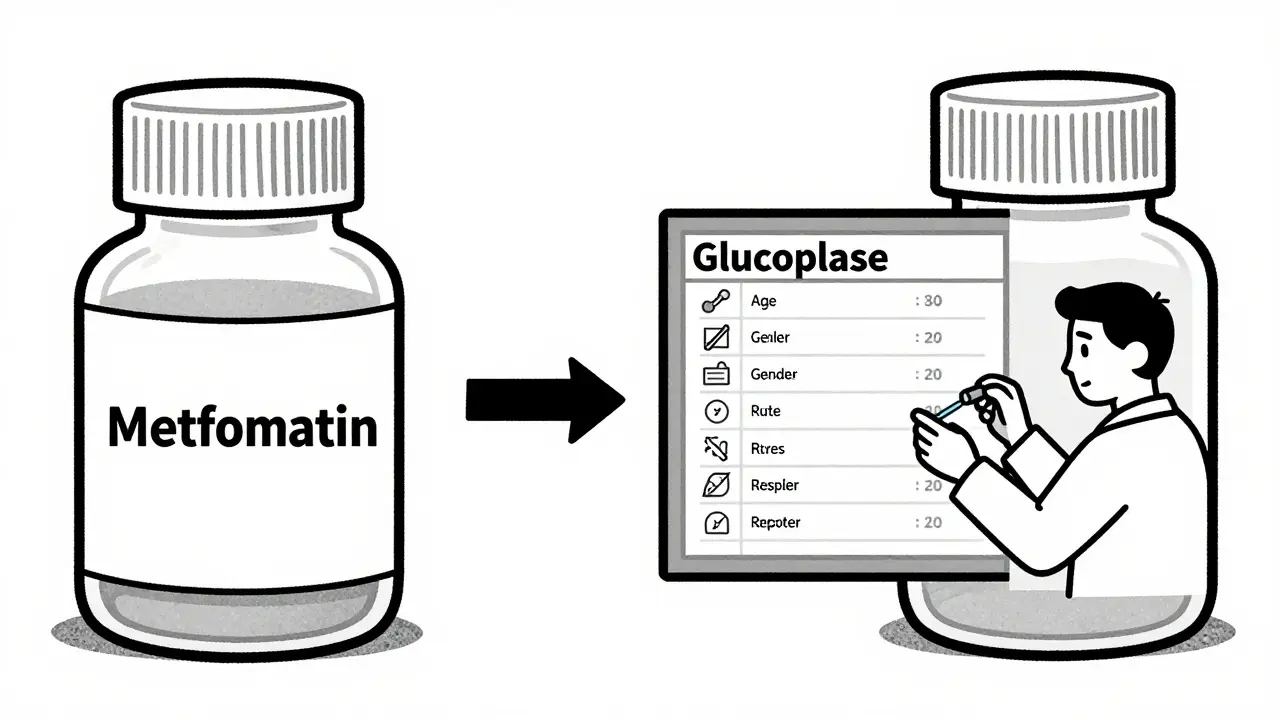
- Type in the generic name of the drug - not the brand name. For example, use “metformin,” not “Glucophage.”
- Click search. You’ll see a bar graph showing reports per year.
- Now, look to the right of the graph. There’s a drop-down menu. Select “Cases by Reaction.”
- That’s where you’ll see the actual side effects reported: nausea, rash, low blood pressure, etc.
Don’t stop there. Use the filters below the graph. You can narrow results by patient age, gender, reporter type (doctor vs. patient), and outcome (hospitalization, death, disability). This helps you spot patterns. For example, if most reports of dizziness come from patients over 70, that’s worth noting.
One mistake people make is searching only one brand name. A drug like “lisinopril” has over a dozen brand names. If you only search “Zestril,” you’ll miss reports under “Prinivil” or “Aceon.” The dashboard lets you enter up to five drug names at once - use that. Search both generic and common brand names together.
When to Use Elsevier’s PharmaPendium
If you need more control - like comparing two drugs side by side or filtering by reporter occupation - try PharmaPendium by Elsevier. It’s a paid tool, but it’s used by researchers and pharmacovigilance teams. You can do things like:
- Compare the reporting rate of kidney injury between two diabetes drugs
- Filter for reports only from healthcare professionals (not patients)
- Use logic operators like “AND” or “NOT” to exclude unrelated terms
- See graphical trends over time, not just raw numbers
For example, if you’re wondering whether a newer cholesterol drug has more muscle pain reports than statins, PharmaPendium lets you pull up side-by-side charts with filters for age group and severity. The Public Dashboard can’t do that.
Use VisDrugs for Visual Comparisons
Most people don’t know about VisDrugs, but it’s a game-changer. Created by researchers at the University of California, it turns FAERS data into easy-to-read charts. You can:
- Upload two groups of drugs and instantly see which one has more reports of a specific side effect
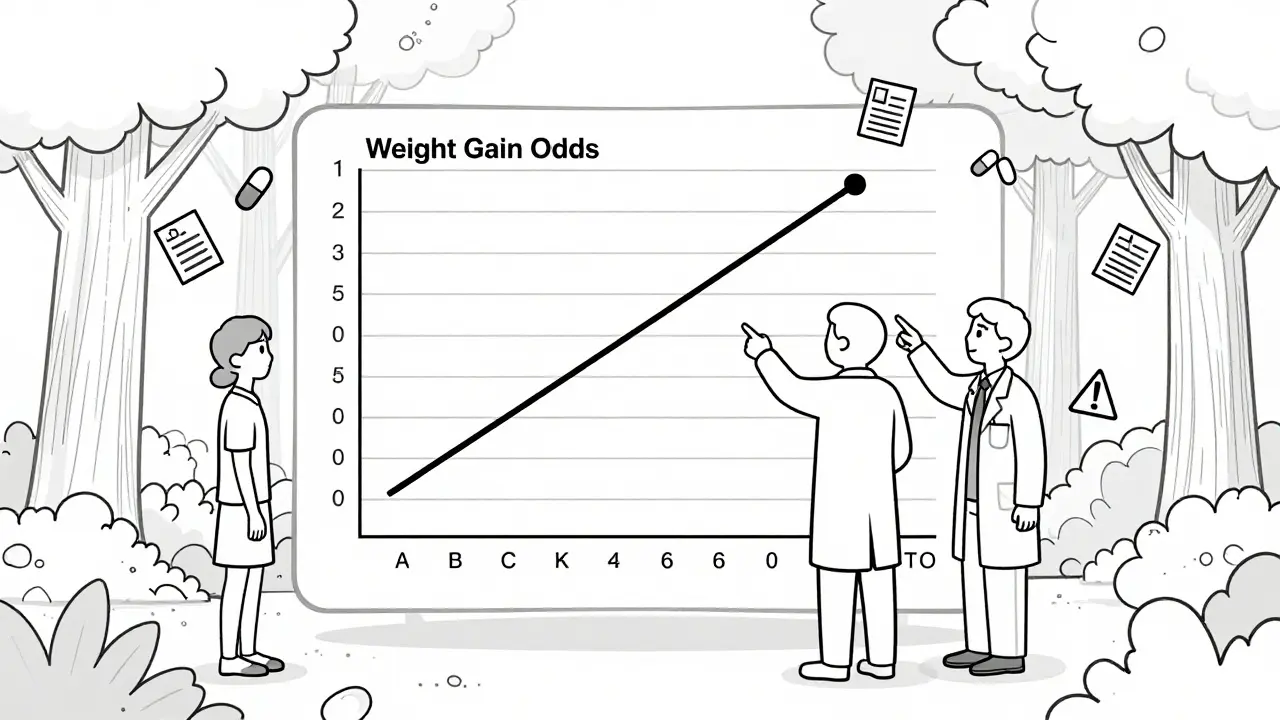
- See forest plots that show odds ratios - if the line crosses 1, there’s no clear difference
- Break down results by gender or age group
Let’s say you’re concerned about a new antidepressant and want to know if it causes more weight gain than older ones. You enter five drugs into VisDrugs. It generates a pie chart showing the top reactions for each. Then it overlays a forest plot showing how likely each drug is to cause weight gain compared to the average. If one drug’s line is far above 1, it’s a signal worth investigating.
Don’t Confuse FAERS With MAUDE
If you’re looking for side effects from a medical device - a pacemaker, a joint implant, or a glucose monitor - don’t use FAERS. Use MAUDE. Devices have multiple versions, similar names, and different manufacturers. Searching “insulin pump” in FAERS will give you nothing. In MAUDE, you can filter by device type, manufacturer, and model number. If you’re unsure what device you had, check your medical records. Your provider can give you the exact name and model.
Understanding the Limits - Why Numbers Can Lie
Here’s the hard truth: FAERS reports are not proof. They’re clues. A drug with 1,000 reports of headache isn’t necessarily more dangerous than one with 100. Why? Because 10 million people take the first drug, and only 100,000 take the second. Without knowing how many people used the drug, you can’t calculate risk.
Also, some side effects are underreported. People don’t always connect a headache to a new pill. Doctors might not report minor reactions. Manufacturers often only report serious events. And the FDA doesn’t verify every report - they’re just collecting them.
That’s why the FDA warns: “You cannot calculate the incidence of an adverse event from FAERS data.” The number of reports doesn’t equal the number of cases. It equals the number of reports. Big difference.
What to Do With This Information
If you’re a patient and you see a scary side effect listed in FAERS, don’t panic. Talk to your doctor. Ask: “Is this common? Is it serious? Does it happen more with this drug than others?”
If you’re a researcher, use FAERS to find signals - then design a study to confirm them. Use VisDrugs or PharmaPendium to compare drugs. Look for trends across age, gender, and time.
If you’re a lawyer or advocate looking into a case, get the medical records first. Find the exact drug name and dosage. Then use FAERS to see if others had similar reactions. But don’t cite FAERS as proof of causation. It’s not.
The real-time update is a win. It means safety signals show up faster. But the system still needs smart users. Don’t take the numbers at face value. Dig into the filters. Compare drugs. Use the right tools. And always remember - FAERS doesn’t tell you what caused the problem. It tells you what people thought might have.
How to Access Raw FAERS Data (For Experts Only)
The FDA releases quarterly raw data files in CSV format. These are massive - millions of rows. You need programming skills (Python, R) and knowledge of MedDRA coding to make sense of them. Most people shouldn’t touch this. Stick to the Public Dashboard, VisDrugs, or PharmaPendium unless you’re trained in pharmacovigilance analytics.
Can I trust FAERS to tell me if a drug is safe?
No. FAERS doesn’t prove a drug causes side effects. It collects reports - some confirmed, some not. It’s used to spot patterns that need further study, not to declare a drug dangerous. Always consult your doctor before making changes to your medication.
Why do some drugs have more reports than others?
Drugs taken by millions of people - like metformin or ibuprofen - naturally have more reports. It’s not because they’re more dangerous. It’s because more people use them. Always compare reporting rates to usage numbers, which FAERS doesn’t provide. Use tools like VisDrugs to compare drugs side by side.
Should I search brand names or generic names in FAERS?
Search both. A drug like “amlodipine” is sold as Norvasc, Katerzia, and others. The Public Dashboard lets you enter up to five drug names at once. Include the generic name and all major brand names to get the full picture.
Is FAERS data real-time now?
Yes, since August 2024, the FDA updated FAERS to add new reports in real time. Before that, data was only updated every three months. This means safety signals appear faster, but it also means the data is still unverified and incomplete.
Can I use FAERS to file a lawsuit?
FAERS data can support a legal case by showing others had similar reactions, but it’s not evidence on its own. Courts require medical records, expert testimony, and proof of causation. Use FAERS to find patterns, then work with a lawyer to gather stronger evidence.
What’s the difference between FAERS and MAUDE?
FAERS is for drugs and biologics. MAUDE is for medical devices like pacemakers, implants, and monitors. Searching for a device in FAERS will give you no results. Always use the right database for the right product type.
All Comments
Lynsey Tyson December 19, 2025
I used to panic every time I saw a scary side effect in FAERS until I learned how to filter by age and reporter type. Now I just check if it’s mostly patients reporting or if doctors are seeing the same pattern. Big difference.
Dikshita Mehta December 20, 2025
Great breakdown. One thing I’d add: always cross-reference with WHO’s VigiBase if you’re comparing global patterns. FAERS is US-heavy - you’ll miss a lot of signals from Europe or Asia if you only look here.
Allison Pannabekcer December 20, 2025
So many people treat FAERS like a Yelp review for drugs. It’s not. It’s a haystack. You need the right magnet to find the needle. VisDrugs is that magnet - I use it weekly for my med reviews. The forest plots alone saved me from ditching a perfectly good antidepressant over a fluke report.
Also, if you’re a patient, don’t Google FAERS and then demand your doctor change your script. Bring the filters. Show them you looked at age groups and reporter types. That’s how you have a real conversation.
And yes, brand names matter. I once missed a whole cluster of reports because I only searched ‘lisinopril’ and not ‘Prinivil’. Rookie mistake.
FAERS doesn’t tell you if the drug broke your liver - it tells you someone *thought* it might have. That’s why we still need clinical trials. This is just the early warning system.
Also, if you’re using this for legal stuff? Get the medical records first. FAERS is a starting point, not a verdict.
Alana Koerts December 22, 2025
Everyone’s overcomplicating this. FAERS is garbage data. Half the reports are from people who took 12 meds and then blamed the new one. The FDA doesn’t even verify them. Just use Pharmapendium and skip the noise.
Dominic Suyo December 23, 2025
FAERS is a dumpster fire wrapped in a government spreadsheet. I’ve seen reports where someone wrote ‘I felt weird after taking metformin’ and it got logged as ‘acute psychosis’. This isn’t science - it’s crowd-sourced hysteria. And now they’re updating it in real time? Brilliant. Now we’ll have panic spikes every time someone tweets about a headache.
VisDrugs? Cute. But unless you’re running a pharmacovigilance team with a $200k budget, you’re just playing with toy graphs. The real data’s locked behind MedDRA codes and Python scripts. Most of you are just scrolling through pie charts like it’s TikTok.
anthony funes gomez December 24, 2025
FAERS: a non-validated, non-normalized, non-denominator-adjusted, post-marketing signal detection instrument - not a risk quantification engine. The conflation of reporting frequency with incidence rate is a persistent epistemic error among lay users and even some clinicians. The absence of exposure data renders absolute risk inferential at best. Use it for hypothesis generation, not conclusion.
Sarah McQuillan December 26, 2025
Y’all are making this way too complicated. If a drug’s got a lot of reports, it’s probably dangerous. I’m not a scientist, but I know what I see. And if 50 people say their liver exploded after taking it, then it’s not safe. End of story. Stop overthinking it.
Mark Able December 27, 2025
Wait - so if I take a drug and get a rash, and I report it, does that mean it’s definitely the drug? Or could it be my cat? I’m just asking because my cat’s been acting weird lately and I’m kinda scared now.
Alisa Silvia Bila December 28, 2025
Just use VisDrugs. Saved me hours.
James Stearns December 30, 2025
It is, indeed, a matter of profound concern that the general public is being encouraged to interpret unverified, non-validated, and statistically unnormalized adverse event reports as definitive evidence of pharmacological causality. Such a practice, while emotionally intuitive, constitutes a gross misapplication of epidemiological principles and undermines the very foundation of evidence-based medicine. One must exercise the utmost intellectual rigor - not emotional reactivity - when engaging with such data.